11.05.2016 by Anete Ezera
GoPro encourages thrill seekers, adventurers, and video junkies to create and share awesome content. Their marketing campaigns are exciting and their products are widely loved. But, all of that content and planning comes with a lot of data.
We sat down with Natalie Kwan, CRM Analytics Manager at GoPro, to talk about GoPro’s successful data-driven strategy and her love of data visualizations.
1) What is your role with GoPro?
I am the CRM Analytics Manager at GoPro. I manage analytics for our brand’s user communications. I am responsible for delivering data-driven insights and optimization which allows the brand to talk to different groups of GoPro fans and customers at the right time with the right message.
This way, we can be sure that we are there to help users get started with our cameras, discover more amazing videos, enjoy our amazing desktop and mobile apps, and learn about our latest products – like our new virtual reality rig!
2) Who loves GoPro?
Our user base consists of many unique individuals. Some are sports enthusiasts who film themselves riding big waves, some are travel-lovers who like to watch fun footage taken from all over the world, some like to record music videos with their GoPro, and so much more.
Our users connect with GoPro in different ways. Some users are just starting to discover all the amazing wide angle shots they can take. Some make professional videos using our GoPro Studio. Some users prefer to watch exciting videos taken by fellow GoPro lovers.

Credit: GoPro ‘Photo of the Day’ – Cloudbreak Kite Session By Reo Stevens
3) Describe your typical work day.
My day-to-day work involves discovering general user behavior as users interact with the brand through apps, website, and emails. I also explore how users interact with the brand through different communication channels. By analyzing past CRM campaign performance, as well as A/B test results, I provide recommendations for upcoming campaigns and communications programs.
4) How much data do you handle daily?
I handle a large amount of data at work. We get millions of visits to our website a month, millions of active mobile app users, and millions of email subscribers. So I have a lot of data to work with, which is awesome!
5) What kind of data do you work with?
A lot of engagement data – how users interact with our brand through our products, our website, and our mobile and email communications. We believe that each GoPro user is a brand ambassador. We believe that the users’ connection with the brand comes from engaging with the capture and consumption of awesome photos and videos. We want users to use their GoPros often and be able to use our suite of software to help them shoot and share content.
6) How do you start organizing large data sets?
Large data sets are usually never organized at the start because the data often comes from different sources and is stored in a variety of formats. Once you have the data, it’s important to do enough data exploration in order to understand what you have and gain insights.
You also need to find out if the data is reliable, if the data points mean what you think they mean, and what kind of preliminary relationship exists between different data fields.
7) How do you share your findings with your team?
A lot of visualizations! They are the best way to share data and have it easily read and understood. We create reports and work a lot with Excel and PowerPoint. I’ll add my notes and comments to the deck about how I did the analysis and why it’s important.
Some interactions are through email if it’s brief. We also have data dashboards that everyone has access to if they want a high-level summary of our performance. But mainly I sit down with my business partners to talk about what the data means.
8) Why is it important for companies to have a data-driven strategy?
A company that measures itself by the right metrics is on the path to success. It’s nice for us to know how we’re doing, and keeping track of the on-going health of the business. Setting up clear and measurable goals also motivates the whole team.
9) Why are data visualizations useful?
Data visualizations are extremely important! Charts make an impact. If you deliver insights with words alone, it’s kind of like talking to your friends about a really yummy restaurant they’ve never been to. You can be very descriptive and precise, but it’s hard for them to get it. But, when you deliver insights with charts, it’s like actually taking your friends to the restaurant to enjoy the tasty food themselves. The experience creates a lasting impression.
10) Why do you like working with data?
I enjoy working with data for many reasons:
- Data analytics is cool! I love being able to steer the business in certain directions, make predictions about what might work, and eventually finding out if it actually works. It’s exciting!
- I love the challenge. Processing and making sense of large data sets requires me to constantly be in problem-solving mode. It takes logical thinking, careful attention to detail, and very good business sense to succeed with business analysis.
- I love learning about people’s behavior.
- I like making sensible decisions and persuading others with concrete facts. Data lets me do that.
11) Tell us about GoPro’s virtual reality camera rig.
It’s called Omni! Omni lets you film 360-degree panoramic photos and videos. Check out our GoPro YouTube and Facebook channels where you can find VR videos filmed with Omni. When you watch the videos, you can pan up and down your phone/tablet and see the person’s perspective. It’s almost like you are completely immersed in someone else’s space!
12) What is your favorite chart type?
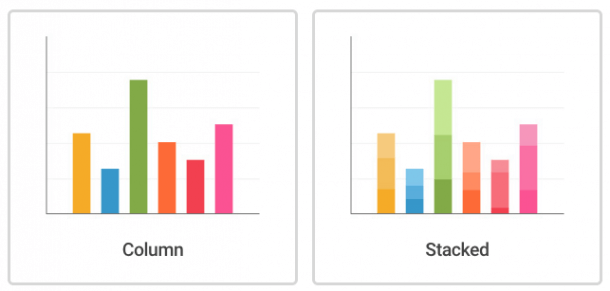
My favorite chart type is the good old stacked column chart. I like to stack several components in a column and display columns over time. With this type of chart, you can make sense of the data quickly.
Is the overall volume increasing or decreasing? How did the change of a particular component contribute to the overall change? Does the breakdown of the components stay consistent over time? What’s the total growth? You can answer all those questions with just one chart!
Feeling excited about data? Infogram has over 35+ different chart types to choose from. You can even make Natalie’s favorite stacked column chart.

Get data visualization tips every week:
New features, special offers, and exciting news about the world of data visualization.