05.01.2017 by Anete Ezera
On behalf of the Infogram family, I’d like to wish you a happy 2017! What a great year it’s been for our team. January is the perfect time to reflect on all we’ve accomplished over the past 12 months. We’ve worked hard to enhance our tool, help our users, and provide quality content for the data visualization community.
To celebrate the new year, we’d like to share a list of our favorite achievements and feature additions:
GIFs (Yay!)
You now have the ability to save any chart as an animated GIF. Not only can you turn any Infogram chart into a GIF, you can also upload GIFs to your Infogram library and add them to your next infographic.

Team Collaboration
Infogram for Teams helps your team visualize data and publish beautiful charts, graphs and reports easily. Shared folders, access permissions, and simple per-seat pricing ensure that your team can efficiently make your data look its best.
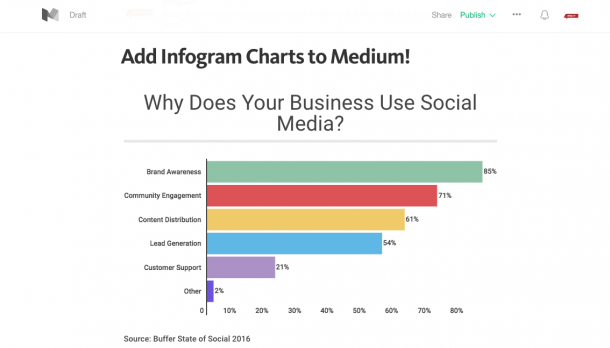
Facebook Instant Articles + Medium Embeds
Make your Medium stories and Facebook Instant Articles more engaging by adding interactive charts. Once you publish your project, copy and paste the Infogram URL into Medium and hit ‘enter.’ You’ll see your chart appear right before your eyes. Here are Facebook’s guidelines for activating interactive embeds.
Tabs for Multiple Datasets
Easily display multiple datasets in a fun, interactive way with Infogram tabs. Our tabs are easy to read and even easier to use. See for yourself.
Table Images
You can now add images to your Infogram tables. To add an image or icon, CTRL-click in the cell of your choice, then select the blue ‘Set image or shape’ button. From here you have access to your image uploads or our huge icon library.
Chart Clickability
Want to add links to elements of your chart? Now you can! Add links to specific bars, columns, and pie slices to drive more traffic to pages on your website or blog. This makes your charts richer and more meaningful.
Blog and App Redesign
Our website, user profiles and company blog all received major facelifts in 2016. Our new designs are simple, intuitive, easy to navigate, and powerful – which helps improve the overall user experience.

Icons and Shapes
With Infogram, you have unlimited access to over 200,000+ icons and shapes. You can search for specific icons or general themes including social media, business, geography, science, design, politics, and more.
New Charts and Maps
New charts are always worth celebrating here at Infogram. Last year we introduced a brand new semi-circle pie chart and a multiple axes chart. We also cleaned up our most popular charts to improve readability and design.
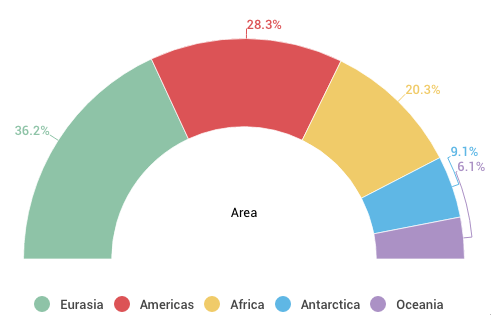
Infogram’s mapping options have skyrocketed. We have more design choices than ever before and over 500+ regional maps to choose from.
U.S. Presidential Elections
Newsrooms around the globe turned to Infogram during the election season – resulting in Infogram’s highest reported traffic ever. News sites knew they needed to be the go-to source for their readers with the latest facts and figures. This is why journalists relied on Infogram to help them visualize their election data.
Data Visualization Workshop
Last year we introduced our Data Visualization Workshop video series! This series consists of instructional videos that are simple and easy-to-follow. We want to show you how to make the most of your data, offering you useful skills and helpful advice.
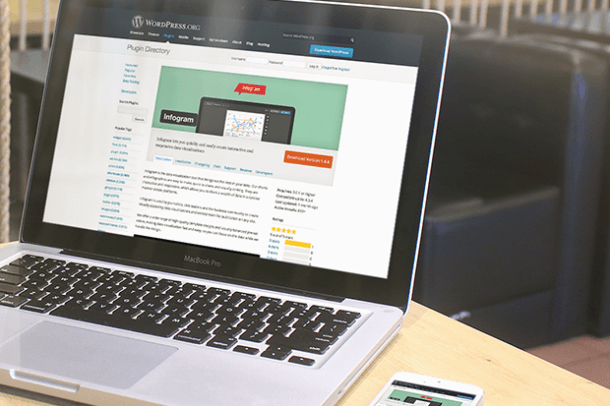
WordPress Plugin Update
We have updated our awesome WordPress plugin. The Infogram WordPress plugin makes it easy to embed and share your work on your site. After installing the plugin, you’ll be able to embed charts and infographics from Infogram directly into your blog posts, without having to leave the WordPress editor.
Expansion Data Centers
Infogram opened a data center in Sao Paulo, Brazil, which improves overall performance for all of our South American users. Our charts load 4x faster bringing a better visualization experience to the entire continent.

Wow – that’s a long list. Are there any features you’d love to see from Infogram? We want to hear from you. Feel free to leave your thoughts. Cheers to a fantastic 2017.
Get data visualization tips every week:
New features, special offers, and exciting news about the world of data visualization.