24.11.2015 by roberts
Do you want to make your storytelling more effective through infographics? I think we all do! Infographics are powerful communication tools. If done well, they effectively combine data and visuals in a way our brains can easily process, absorb, and retain.
Tools like Infogram are here to help you easily create beautiful charts and infographics, but it’s up to you to use them to generate leads and grow your brand. In a collaboration with HubSpot we created this guide to show you how to do just that.

Here is a sneak peek of what you’ll find inside:
Why Use Infographics?
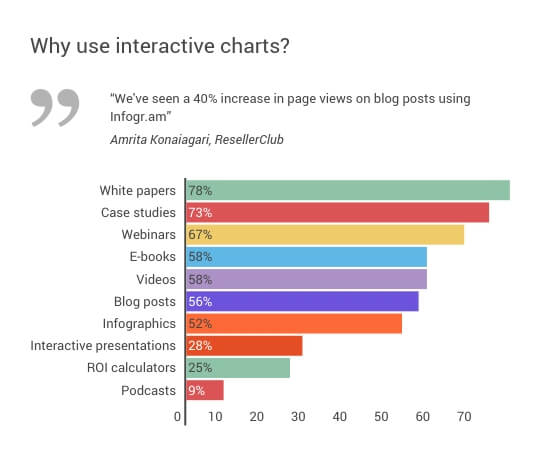
The use of infographics in B2B marketing jumped by 9% to 52% in 2014 – meaning marketers are putting a stronger emphasis on visuals to dramatically improve the performance of their content.
In fact, verbal presentations using visual content have been proven to be 34% more effective when compared to verbal presentations alone. And, an infographic is up to 30 times more likely to be read than a text article. But, some people find it hard to get the right data, create beautiful graphics on their own, promote their work in a professional way, and accurately measure their campaign’s success.
Why Should You Care About Infographics?
 Learning how to consistently share effective charts and infographics can benefit you in multiple ways. Mastering this craft will allow you to increase customer engagement and lead conversion rates, increase the retention of your message and overall brand experience, and ultimately increase the influence your brand identity has on purchasing decisions.
How Do You Make an Effective Infographic?
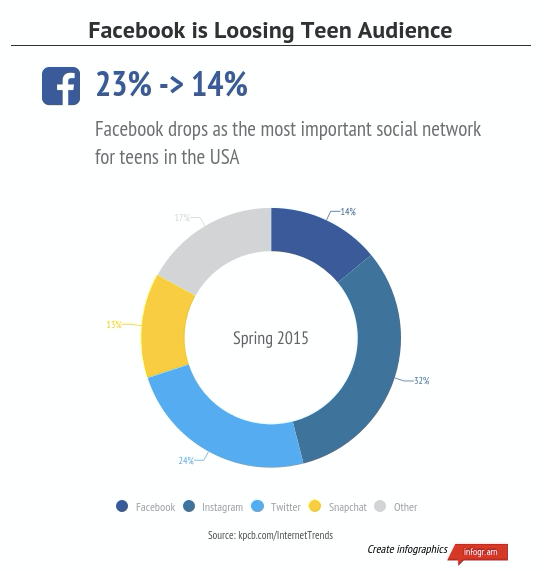 When making an infographic you must tell a story – try to sum up your message in just one sentence – remember less is more! Keep your message simple and clear, use good data, offer a new twist or surprising bit of information, optimize keywords, make it easy to share, and add one solid call-to-action.
What Should You Avoid When Making an Infographic?
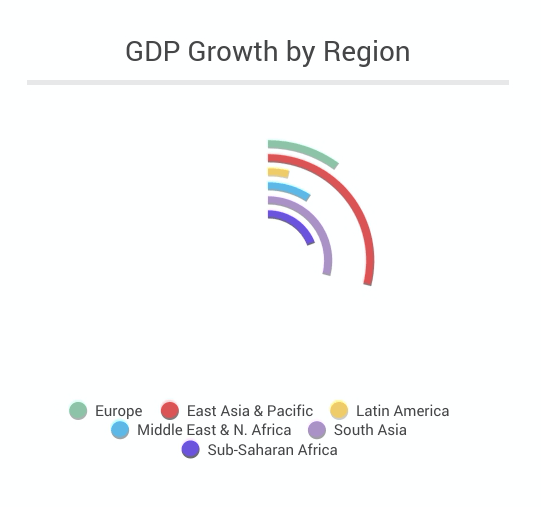 Make sure you don’t confuse or bore the viewer by using vague, unrelated headlines. Also avoid using too much data, funky graph formats, or the data trap – making your infographics too long to keep your viewer’s attention. Your charts and infographics are supposed to evoke emotion and tell a story using data, not state the obvious or hurt your credibility
Promoting Your Infographic
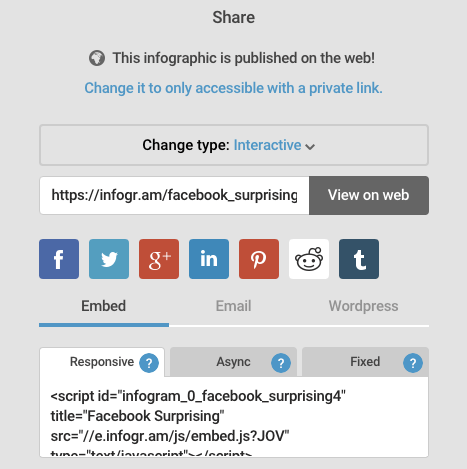 Once you’ve created your infographic, it’s time to spread the word. Embedding your infographic on your website drives traffic back to your site, which is great, or you can embed it in a blog post. Encourage others to share your infographic by making it easy to click and share across all social media platforms including Facebook, Twitter, Pinterest, Google+ and Linkedin.
Conclusion
The Full eBook Teaches You:
- What infographics are and why you should care
- The “dos and don’ts” – How to create an effective infographic
- How to optimize your infographic for lead generation
- How to promote your infographic
- How to measure the success of your infographic campaign
Want to tell better stories and create shareable infographics? Click below to download our free eBook collaboration with HubSpot, How to Start Generating Leads with Infographics.
Get data visualization tips every week:
New features, special offers, and exciting news about the world of data visualization.