08.09.2016 by Anete Ezera
Who doesn’t love customizing their work? With Infogram, you have unlimited access to over 200,000+ icons and shapes. Our tool is integrated with the Noun Project, the world’s most complete source for quality icons. You can search for specific icons or general themes including social media, business, geography, science, design, politics, and more.
Would you like to experience the full power of data visualization? Try Infogram for Teams or Enterprise for free! With a Team or Enterprise account, you can create up to 10,000+ projects, collaborate with your team in real time, use our engagement analytics feature, and more. Request your free demo here.
Icons bring life and personality to your work. Here are the ways you can add awesome shapes and icons to your next Infogram project:
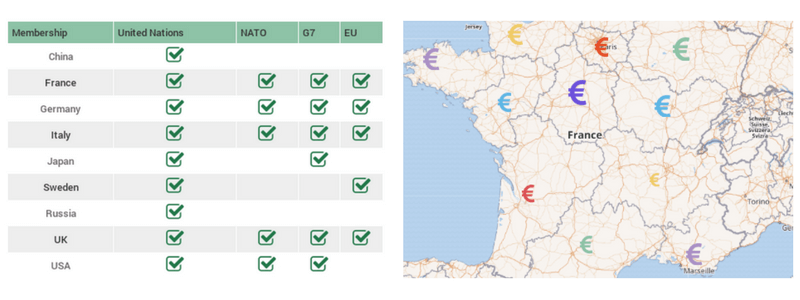
Tables and Maps
Icons make your tables and maps more memorable. Simply open your chart settings, find the ‘shape’ drop-down menu, and explore. Once you’ve chosen your icon you can stick to a pre-designed color template or pick the colors yourself. The options are endless!
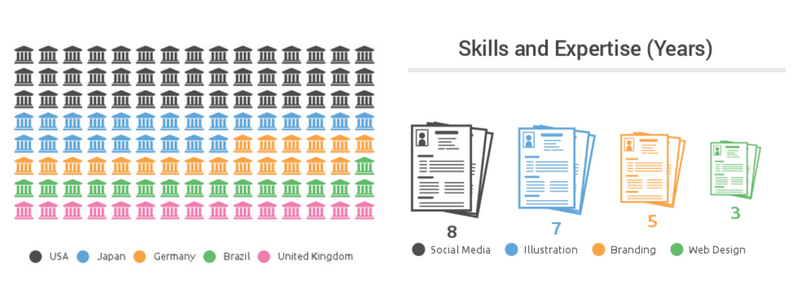
Pictorial and Size Comparison
Infogram’s pictorial and size comparison charts are perfect for our new icons. Add flare to your next presentation, report, post or infographic resume. Again, locate the ‘shape’ menu from your chart settings and search for the icon that best represents your data.
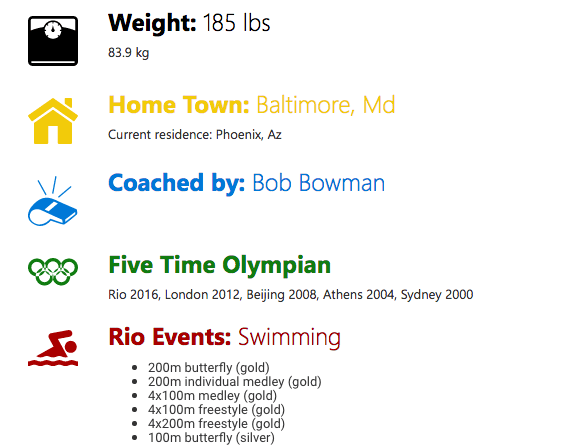
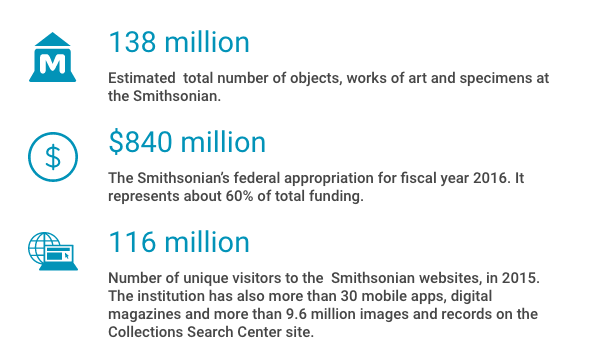
Facts & Figures
Infogram’s facts & figures charts are really popular among journalists, marketers, business professionals, and infographic lovers. They are a great way to grab your viewer’s attention with visuals and statistics. We will let these five great examples speak for themselves.
1) The Amazing Michael Phelps
2) 170 Years of the Smithsonian
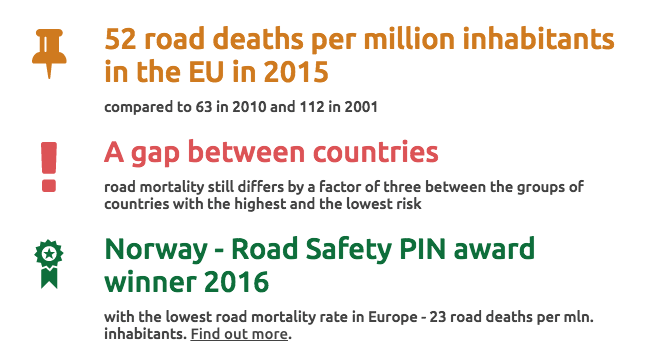
3) Road Deaths in the EU
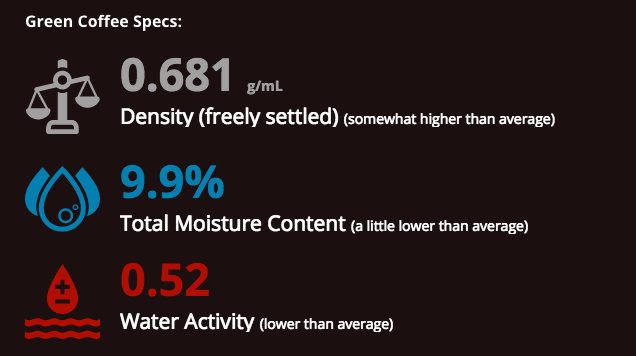
4) Royal Coffee
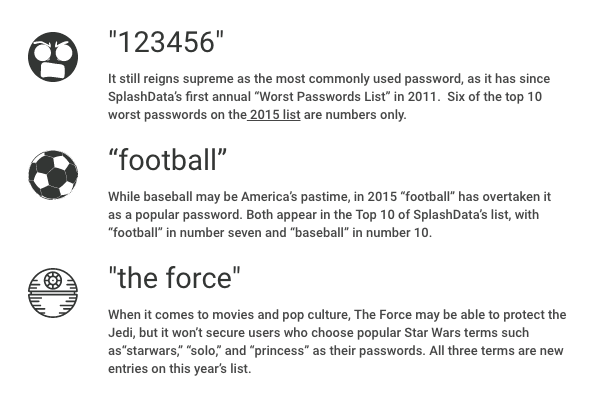
5) Weak Passwords
We know you can’t wait to search through our huge icon library. Sign up or log in to Infogram to create a table, map, pictorial, or facts & figures chart of your own.

Get data visualization tips every week:
New features, special offers, and exciting news about the world of data visualization.