16.08.2016 by Anete Ezera
The data visualization community is thriving on social media and the following continues to grow. More data-loving bloggers, influencers, and organizations are posting their work and passion online than ever before.
Finding ways to add fun visualizations and data news to your wall is easy! We’ve decided to share 9 data-driven Facebook groups we are excited to follow:
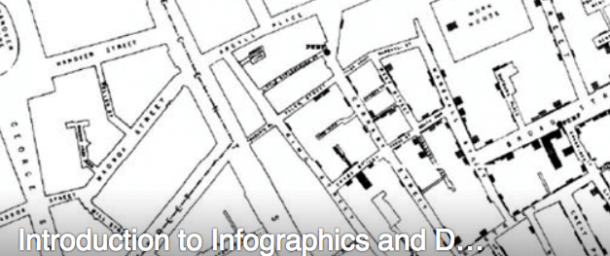
1) Introduction to Infographics and Data Visualization
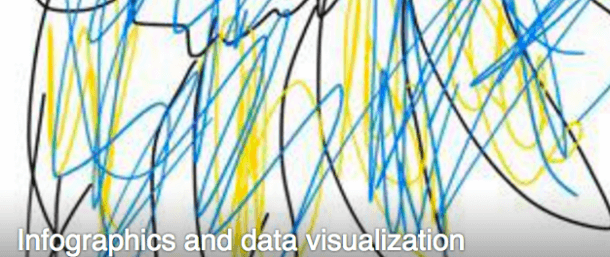
2) Infographics and Data Visualization
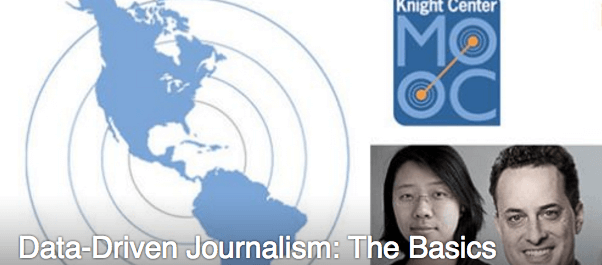
3) Data-Driven Journalism: The Basics
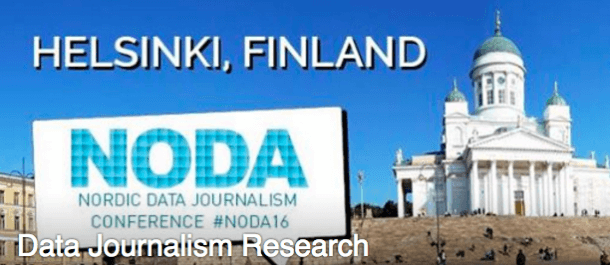
4) Data Journalism Research
5) School of Data
6) Data Visualization and Infographics with D3
7) Data Science
8) Political Science Data

9) Digital Storytelling
If you love data stories and great charts you should ‘like’ Infogram on Facebook! We often post the latest data visualization news, charting ‘how to’s, and updates from the wonderful infographic community.

Get data visualization tips every week:
New features, special offers, and exciting news about the world of data visualization.