02.02.2016 by Anete Ezera
The nature of strategy, especially in the digital age, varies greatly from business to business. However, one thing is certain – organizations need a well-planned data-driven strategy in place to help them achieve their goals.
Creating a successful strategy can be daunting, but the tips below should have you on your way towards developing a solid strategy with data in just minutes.
Analyze Last Year’s Numbers
January is the perfect time to organize your business’ key metrics from the previous year in order to create a successful strategy for the following months. Processing this data can be overwhelming, given the sheer size of the information and the limitless methods available for data capture. One great way to manage all of your company’s metrics is to set up a dashboard.
Create a Dashboard
A metrics dashboard is a visual representation that gives executives a quick and easy way to view their company’s performance in real-time. They combine all of your important information in one place, including, among others, your accounting software, your customer relationship management (CRM) system, your email system, your website analytics program, etc.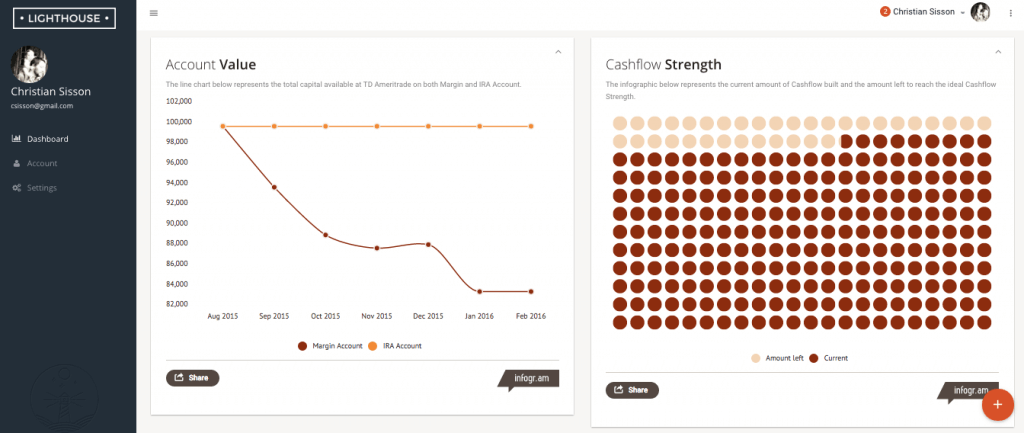 According to Forbes, these data-driven dashboards are highly beneficial for 5 reasons:
- Visibility: An executive dashboard gives you great visibility and insight. You know exactly what’s going on in all aspects of your business. This allows you to better manage it.
- Ongoing Improvements. One of Peter Drucker’s most famous quotes is, “if you can’t measure it, you can’t improve it.”
- Time Savings: The right dashboard always shows you the latest results from each report you need. This saves precious hours each month.
- Judge Performance Against Your Plan: Your dashboard can automatically show your goals from your business plan versus your actual, real-time results.
- Employee Performance Improvements: When employees know their performance is being judged in a dashboard, and can see their results, they innately start to improve their work.
Write it Down
A surprisingly large percentage of businesses and marketers don’t have a written strategy. They spend a lot of time thinking about their strategy, but without putting pen to paper, many of the ideas discussed aren’t implemented correctly or they fall through the cracks. It’s important to write down your goals, see the numbers, and create a plan to track your successes or failures.
Sit down with your team and identify the purpose of your strategy and where to start. It is helpful to make a checklist! That way everyone is on the same page, everyone knows their role and responsibilities, and progress can be measured.

Visualize Your Data
Now that you have the data you want to analyze, we highly suggest you visualize it. Data visualizations allow you to present your data in an engaging way that is both easy to understand and instantly memorable. Online data visualization tools like Infogram make it easy to quickly plug in the numbers and create beautiful charts and graphs. Visualized data helps you recognize trends, explore complex relationships, and view areas in your organization that need improvement.
Social Media Reports
Most social media publishing tools offer mountains of data based on your social performance for you to analyze. These metrics should guide new social strategies for the year. Pick the data that means the most to you, and compile a report. Be sure to evaluate clicks, interactions, shares, likes, comments, and overall engagement.
Don’t forget the bottom line – social media success isn’t just brand awareness and community building, it is also about getting people towards the end of the funnel. You ultimately want your social media presence to push people closer to visiting your website, purchasing your product or service, and sharing with their friends.
Not sure how to create a social media report? Infogram ambassador and data analyst, Marie Smith, offers you 5 steps to an insightful social media report.
Take a Look in the Mirror
We all know how important it is to track your brand success with external audiences, but it is also crucial you examine and understand the strength of your brand internally. We suggest you field an employee survey twice a year to evaluate the views, wants, and needs of those in your company. This will give you insights and help you adjust your brand strategy for the year.
Stay Informed & Be Inspired
Chances are your industry is constantly changing, so you need to be ahead of the curve. If you stay on top of the latest trends and keep yourself informed, you will make better decisions regarding your strategy and find a little inspiration along the way.
Here are 20 fun facts and figures from Axonn Media to inspire, intrigue and motivate you. The slideshow may be aimed at marketers, but professionals in any industry can find some key takeaways from the stats below!
Would you like to experience the full power of data visualization? Try Infogram for Teams or Enterprise for free! With a Team or Enterprise account, you can create up to 10,000+ projects, collaborate with your team in real time, use our engagement analytics feature, and more. Request your free demo here.
Get data visualization tips every week:
New features, special offers, and exciting news about the world of data visualization.