12.01.2016 by Anete Ezera
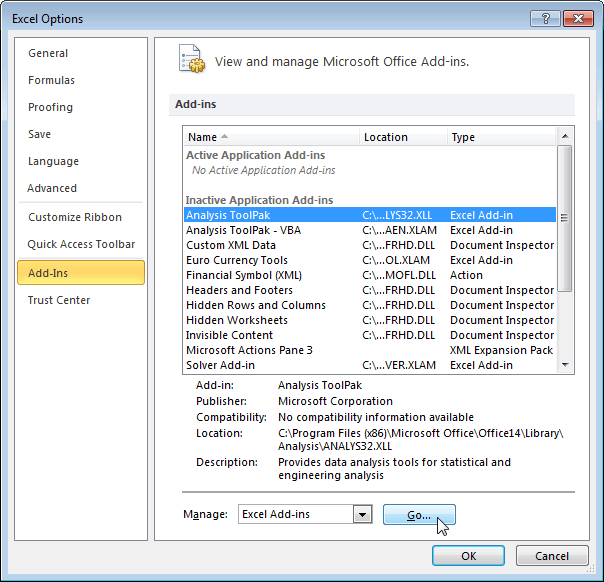
Excel add-ins are special files that extend the functionality of Microsoft Excel, beyond its basic spreadsheet capabilities. Excel actually comes bundled with a handful of popular add-ins, you just need to locate and activate them. Try File > Options > Add-Ins to see what is already available within your version of Excel. If you choose to download an add-in, you can use the Add-Ins Manager to install it.
Now, it’s time to push Excel to the limit. Let’s go over some of the best Excel add-ins that make it easier for you to find, process, and analyze your data.
Analysis ToolPak
The Analysis ToolPak is a Microsoft Office Excel add-in program that is available when you install Microsoft Office or Excel. It allows you to develop complex statistical or engineering analysis, all while helping you save steps and time. You provide the data and parameters for each analysis, and the tool uses the appropriate statistical or engineering macro functions to calculate and display the results in an output table.
Power Pivot
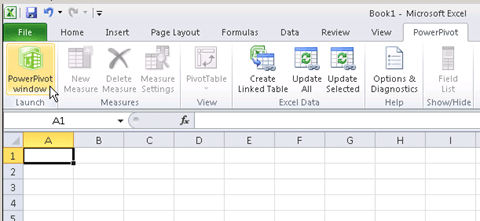
Power Pivot is a free add-in you can use to perform powerful data analysis in Excel. It makes it easier to handle massively large data sets than your basic version of Excel. You can process huge amounts of data in seconds, as well as load even the largest data sets from virtually any source. The add-in is built into certain versions of Excel, but by default, it’s not enabled. Here’s how you enable Power Pivot before using it for the first time.
Solver
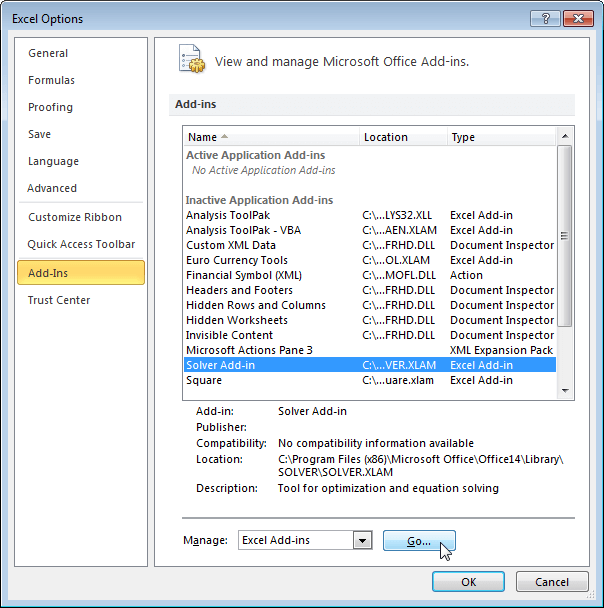
The Solver Excel add-in is a what-if analysis tool for optimization. It is licensed from Frontline Systems that has shipped with Excel for many years. Solver helps to find an optimal value in one cell, called the target cell, on your worksheet. According to the Microsoft Office blog, it works by changing a group of cells related to the target cell to find an optimal value subject to the constraints that you set. You can use Solver, for example, to determine the most efficient shipping routes, maximize income/sales/etc., or discover the best product mix.
Random Generator
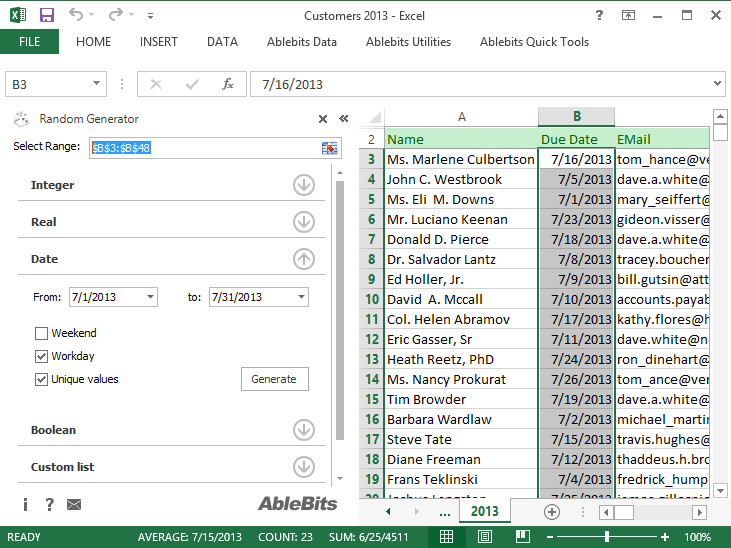
The Random Generator add-in populates selected cells with random numbers, dates, and values – much like dummy data. This is helpful if you want to create a spreadsheet mockup but don’t want to come up with your own fake data. Select the cells you want to fill and choose between adding random numbers, random dates within a range, or random Boolean “true” and “false” entries.
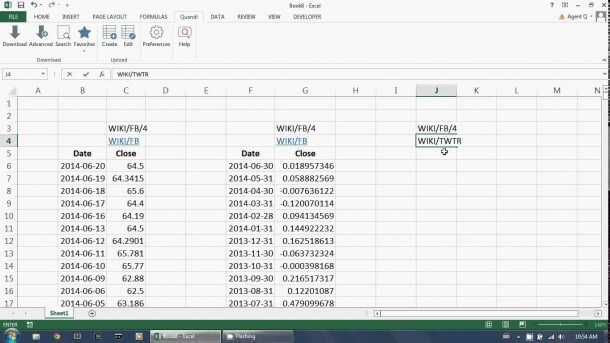
Quandl
Quandl is a platform covering millions of financial and economic time-series datasets from hundreds of sources. In short, Quandl makes numerical data on the internet easy to find and easy to use.The Quandl Excel add-in allows you to search through, find and download any of Quandl’s millions of datasets directly from within Microsoft Excel. You can also use the add-in to upload, edit and maintain your own data on the Quandl website. The best part is that it’s totally free and usage is unlimited and unrestricted.
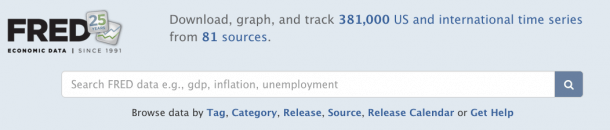
FRED
Search the Federal Reserve Bank of St. Louis Economic Data (FRED) database to browse the most popular data available today, directly through Excel. You can search popular U.S. data, popular international data, and popular data releases. The FRED add-in provides free access to over 380,000 data series from various credible sources. It’s great because it significantly reduces the amount of time you spend collecting and organizing macroeconomic data.
Once your data is processed and ready to go, upload it to Infogram. We offer more than 30 different chart types featuring specially designed themes that make your data pop. And, if you really want to stand out and engage your readers, embed the code we provide to publish interactive and responsive data visualizations.
Click below to begin making your own charts, graphs, and infographics today!

Get data visualization tips every week:
New features, special offers, and exciting news about the world of data visualization.