12.05.2016 by Anete Ezera
Time is precious. At Infogram, we know how important it is for you to work quickly and effectively, creating powerful data visualizations to add to reports, websites, blogs, presentations and marketing materials.
Here are just 10 Infogram features that can increase your productivity and help you work smarter with data:
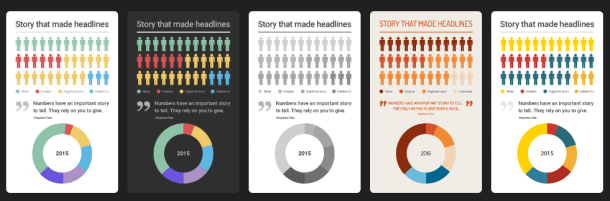
1) Templates
Infogram offers professional templates that are lightweight, beautiful, and responsive. We take the design work out of your chart or infographic. All you have to do is plug in the numbers and publish!
2) Switch Chart Type
Infogram now has 35+ different chart types available, and more are on the way. You can easily switch chart types once you have already started a new project. This way you can make sure you have the perfect visualization for your data.
3) Teams
Infogram recently announced Infogram for Teams. Our teams feature offers shared folders, access permissions, project author images, and simple per-seat pricing. This makes it easy for your team to work efficiently with data, together.

Would you like to experience the full power of data visualization? Try Infogram for Teams or Enterprise for free! With a Team or Enterprise account, you can create up to 10,000+ projects, collaborate with your team in real time, use our engagement analytics feature, and more. Request your free demo here.
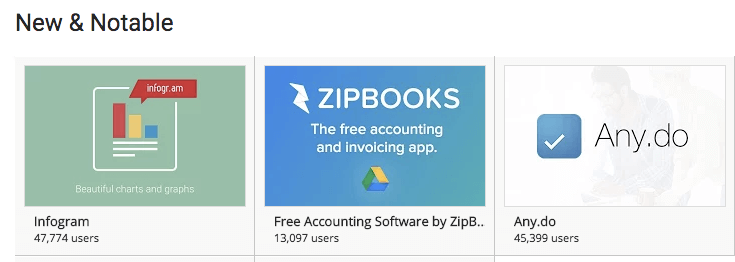
4) Google Drive
Download Infogram Charts from the Google Apps Marketplace ‘New & Notable’ section. Easily access Infogram projects you’ve created straight from Google Drive. You can quickly share images of your Infogram projects from Google Drive – no need to publish first. Plus, changes made to your projects will update in real time across Google accounts.
5) Duplicate Projects
Duplicate your project so you can make changes worry free or create a new chart with the same format. You already spent time getting your last project just right, so this feature helps you start right where you left off.
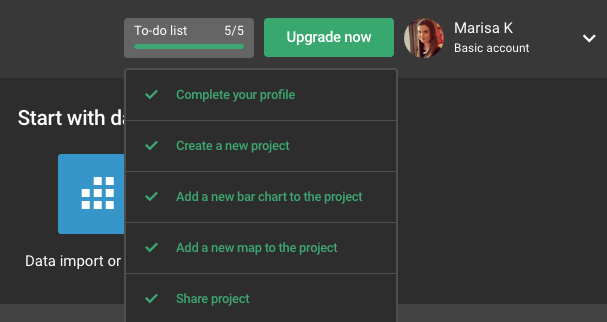
6) Checklist
New Infogram users are greeted with a five point achievement checklist to help guide them through the visualization process and show them the ropes. They are taught how to create new projects, add elements, and share their work in a fun, interactive way.
7) ’Data First’ Import Options
We now have even more options for importing data to Infogram, for those of you who want to start with data first and get designing fast.
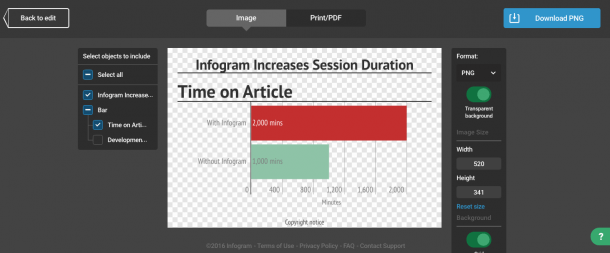
8) Download
With our paid plans, you can download static versions of your charts and graphs. Quickly add PNG or JPEG files to PowerPoint presentations, emails, Word documents or online design tools like Canva. You can make the background of PNG downloads transparent so they slip seamlessly into your work.
9) Quick Publish & Un-publish
You can publish and un-publish projects right from your library, without having to open the project’s settings, which saves you a few steps.
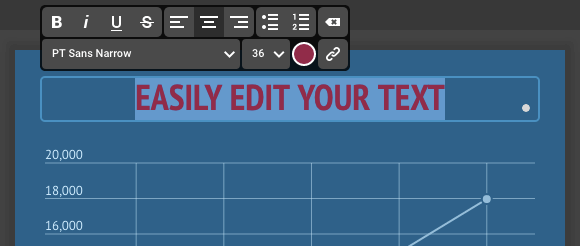
10) Rich Text Edit
Now you can customize your projects faster with our rich text editor. With our paid plans, you can edit text font, size, and color from the text editor. Editing options depend on the theme you’ve chosen.
Want to see these time-saving features in action? Sign up or login with Infogram to unleash the full power of our popular visualization tool. And, if you’d like more helpful information, check out the Infogram FAQ.

Get data visualization tips every week:
New features, special offers, and exciting news about the world of data visualization.